Project overview and goals
The goal was to build a small but realistic detection engineering environment: create controlled activity in an isolated network, preserve useful telemetry, and prove that custom rules can turn that telemetry into investigator-ready Wazuh alerts. I focused on two data sources with different value: Windows PowerShell process telemetry and pfSense firewall decisions.
The finished baseline includes two custom detections. Rule 100101 identifies suspicious PowerShell execution flags on the Windows endpoint. Rule 100102 identifies the intentionally scoped ICMP path from ATTACK01 to WIN11-01.
Architecture and scope
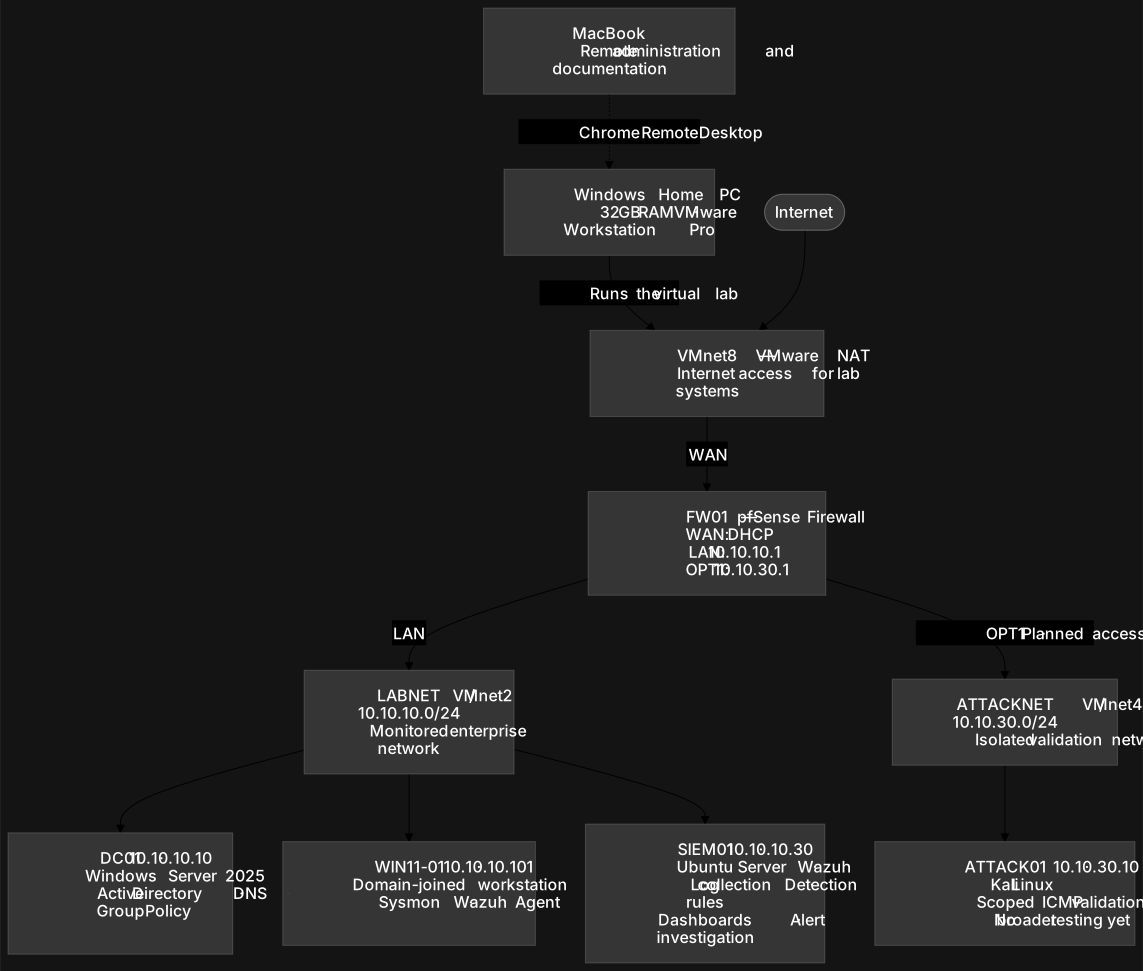
I created the lab in VMware Workstation and placed its systems behind a dedicated pfSense firewall. The firewall connects VMware NAT on its WAN side to the isolated LABNET on its LAN side. The monitored network uses 10.10.10.0/24, with pfSense at 10.10.10.1, DC01 at 10.10.10.10, SIEM01 at 10.10.10.30, and WIN11-01 at 10.10.10.101.
pfSense OPT1 routes the isolated 10.10.30.0/24 ATTACKNET. Static addressing on the core systems made DNS, directory services, and log collection predictable during testing.
Identity and DNS
DC01 runs Windows Server 2025 as the first domain controller for lab.williamgao.dev. I installed AD DS and AD-integrated DNS, configured DNS forwarding through pfSense, and organized the directory into OUs for users, workstations, servers, service accounts, and security groups. WIN11-01 was joined to the domain and placed in the Workstation OU.
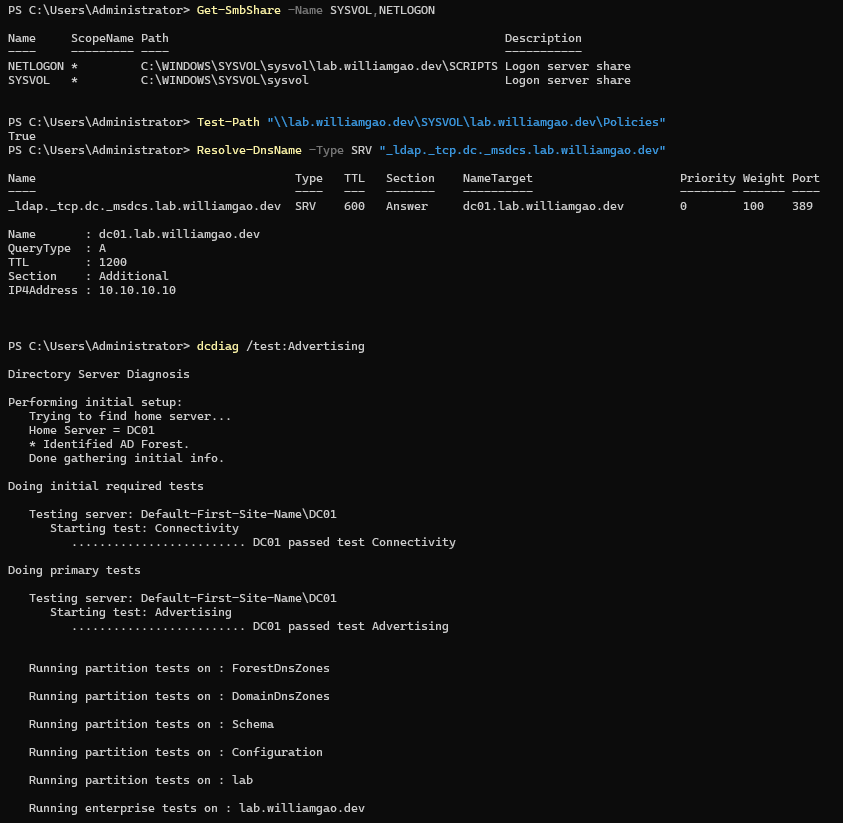
I verified the environment instead of stopping at a successful installation screen. The checks confirmed SYSVOL and NETLOGON shares, the domain controller's LDAP SRV record, and successful DCDiag tests for advertising, SYSVOL, NetLogons, and DNS.
Endpoint controls
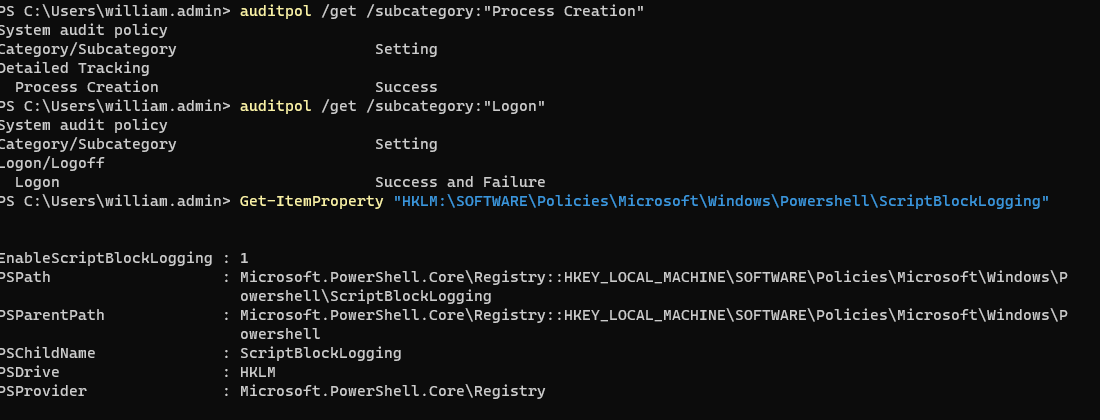
I used Group Policy to apply security settings to WIN11-01. A workstation security group was added to the endpoint's local Administrators group, and advanced audit policy captured successful process creation plus successful and failed logons. PowerShell script-block logging was enabled so executed script content would be available for investigation.
I validated the resulting telemetry locally: Windows Security Event ID 4688 exposed process lineage and command-line context, while PowerShell Event ID 4104 recorded script blocks. This established a useful baseline before forwarding data to the SIEM.
Detection pipeline
Windows activity starts on WIN11-01, where Group Policy enables process creation and PowerShell script-block logging and Sysmon adds process, file, DNS, and network telemetry. The Wazuh agent forwards those events to SIEM01, where the manager applies built-in and custom rules before the Indexer makes the alert data searchable.
Firewall activity follows a second path: FW01 sends firewall events by remote syslog over UDP/514 to SIEM01. A custom pfSense decoder extracts the source and destination IP addresses; rule 100102 then matches the exact safe-validation flow. The two paths demonstrate endpoint and network-layer detection rather than relying on only one telemetry source.
SIEM deployment
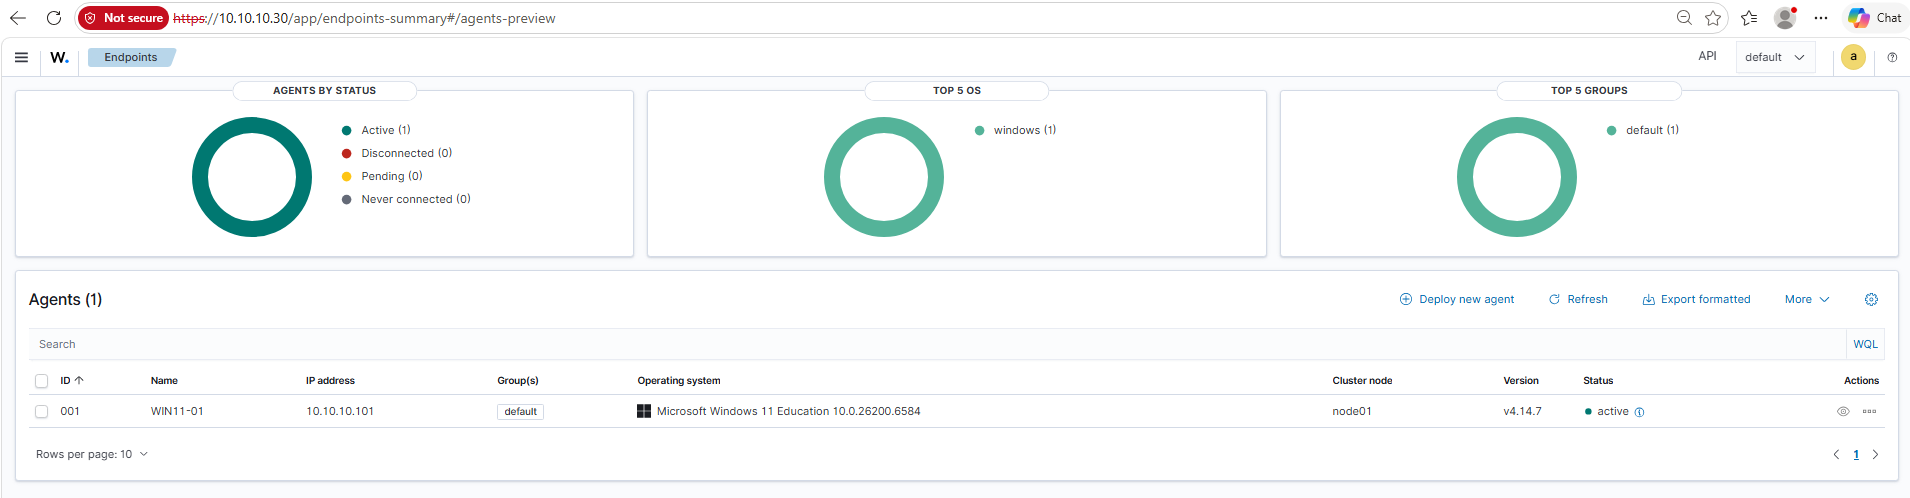
SIEM01 runs Ubuntu 24.04 LTS with Wazuh 4.14.7. I deployed the Wazuh manager, Indexer, and Dashboard, confirmed the dashboard's API connection, and enrolled WIN11-01 as an active Windows agent.
PowerShell detection 100101
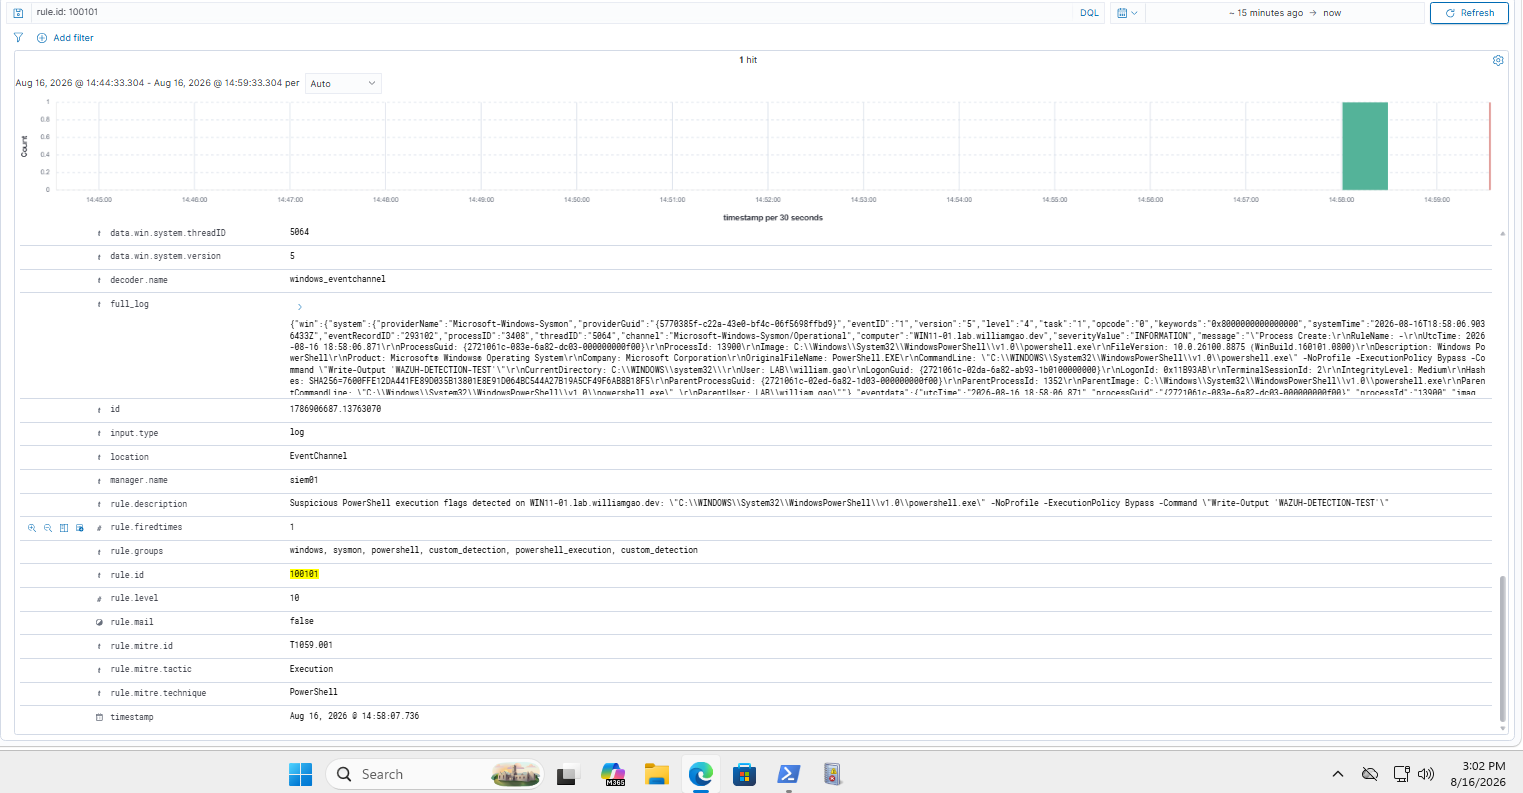
I wrote custom Wazuh rule 100101 to detect PowerShell executions that use high-signal flags such as encoded commands, execution-policy bypass, no-profile mode, or hidden windows. The rule builds on the Windows Sysmon process-creation event and specifically matches powershell.exe plus the suspicious command-line pattern.
I assigned the rule severity level 10 and mapped it to MITRE ATT&CK T1059.001 (PowerShell). A controlled test using -NoProfile -ExecutionPolicy Bypass produced the expected alert for WIN11-01 and retained the full command line for triage.
pfSense ICMP detection 100102
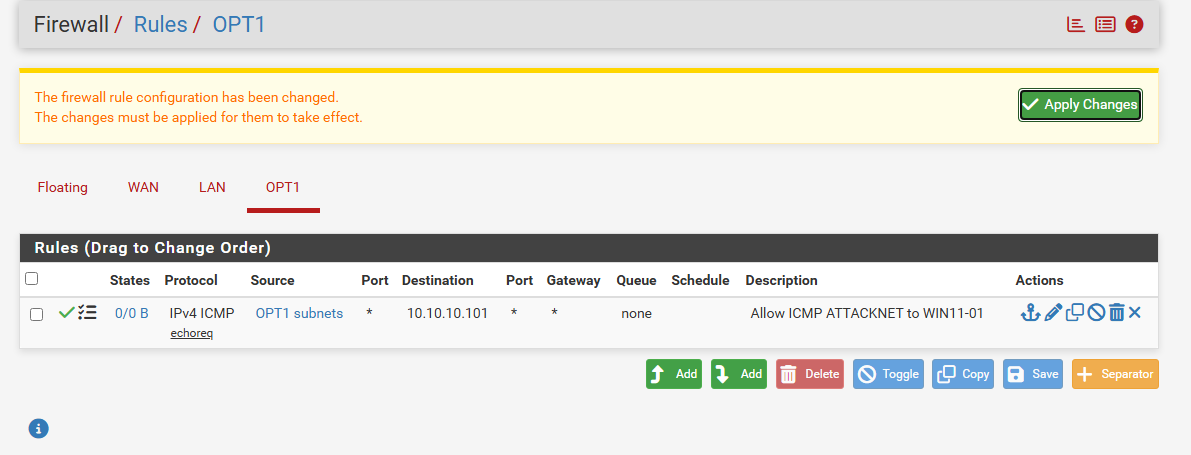
I added ATTACKNET as a host-only segment behind pfSense OPT1 and used default deny as the baseline. I then created one precise allow rule: IPv4 ICMP echo requests from 10.10.30.10 (ATTACK01) to 10.10.10.101 (WIN11-01). The Windows firewall was also limited to ICMP from 10.10.30.0/24.
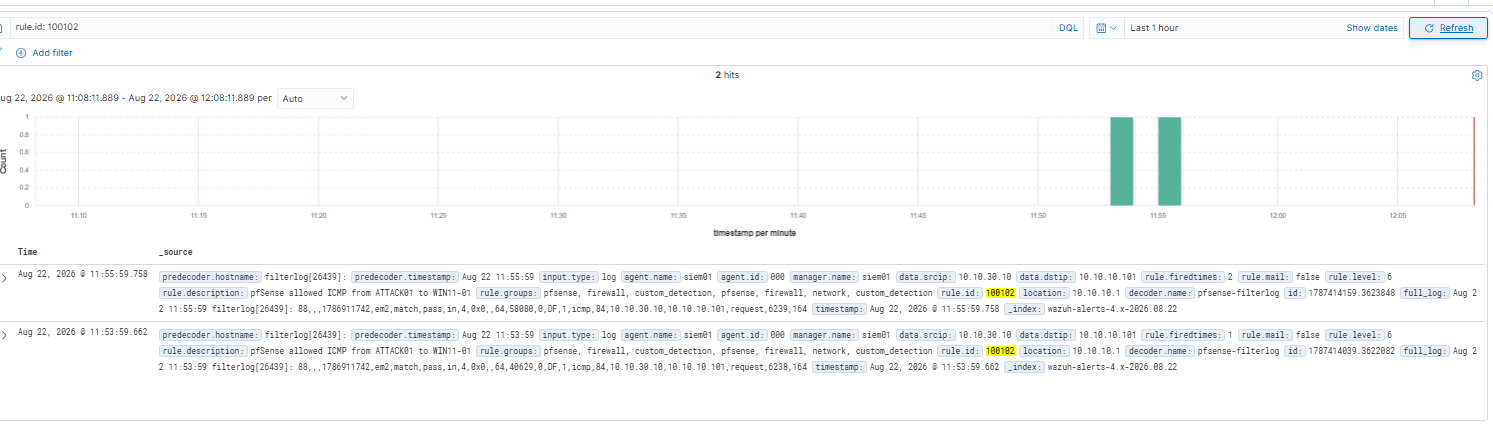
FW01 forwards firewall events to SIEM01 through remote syslog. I created a custom pfSense decoder for filterlog ICMP records and rule 100102, which matches the exact source and destination above. This turns a permitted, controlled action into a visible network detection rather than an unexamined firewall log.
Validation chain and selected evidence
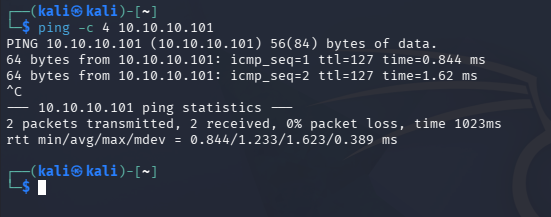
I validated the network detection with a single ICMP request from ATTACK01 to WIN11-01. The request succeeded only because it matched the narrow pfSense and Windows firewall rules. pfSense recorded the pass decision, forwarded the event to SIEM01, and Wazuh rule 100102 produced the expected alert with source 10.10.30.10 and destination 10.10.10.101.
The captured evidence independently proves each stage: ATTACK01 connectivity, the pfSense pass log, and the Wazuh custom alert. The current screenshots were taken at separate times, so they document a validated path rather than one packet-level, timestamp-correlated trace.

Engineering decisions
- Isolation: routed the lab through pfSense instead of placing test systems directly on the physical network.
- Stable dependencies: assigned static addresses to the firewall, domain controller, and SIEM so identity and collection services remained predictable.
- Layered telemetry: combined native auditing with Sysmon instead of relying on a single event source.
- Detection as code: used versioned local Wazuh decoder and rule files to make the PowerShell and pfSense detections explicit and repeatable.
Scope, safety, and current limitations
This is an isolated lab, not a production environment. Testing to date is limited to a narrowly scoped ICMP echo validation from ATTACK01 to WIN11-01. No exploitation, credential attacks, lateral movement, persistence testing, or broader offensive activity has been performed.
The ICMP rule is intentionally restrictive: it names one source, one destination, and one protocol. The existing screenshots show the connectivity, firewall decision, and Wazuh alert, but no retained packet capture explicitly documents the UDP/514 syslog handoff. Future evidence will add synchronized timestamps or a packet capture for a single end-to-end trace.
Lessons learned and future scenarios
The lab reinforced that a working agent or a permitted firewall rule is not the final result. The useful outcome is a validated, explainable alert with the fields an analyst needs to investigate. It also showed the importance of testing each handoff in a logging pipeline instead of assuming data is available because a service reports healthy.
Next, I plan to add controlled ATTACKNET scenarios, detection tuning, MITRE ATT&CK coverage notes, alert triage, and documented containment decisions. Those are future goals and are not represented as completed skills on this page.